


Design Rainfall Ifd - The Weather Chaser
Intensity Frequency Duration (IFD) design rainfalls can be used to understand the expected frequency of a rainfall amount at a particular location over different periods of time. So, for instance, it allows you to determine if, during a rain event there was say 50mm in one day, what the Annual Expected Probability (AEP) of that event, for that location is.
We provide IFD graphs based on the 2016 IFD design rainfalls that allow you to answer questions like that, and also find out what interval of time (hour, day etc) had the most infrequent amount of rainfall for that location.
When you create an export of observations you will also be provided with a link to the IFD chart for that event.
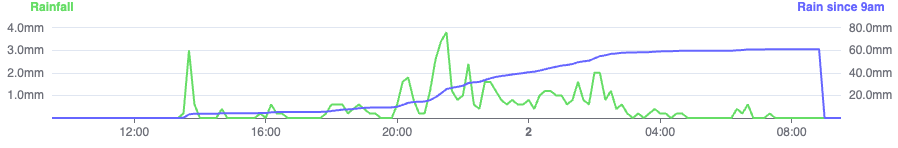
This is an example of a rainfall event from the 1st of April 2024 as recorded by the Frankston, Ballam Park AWS
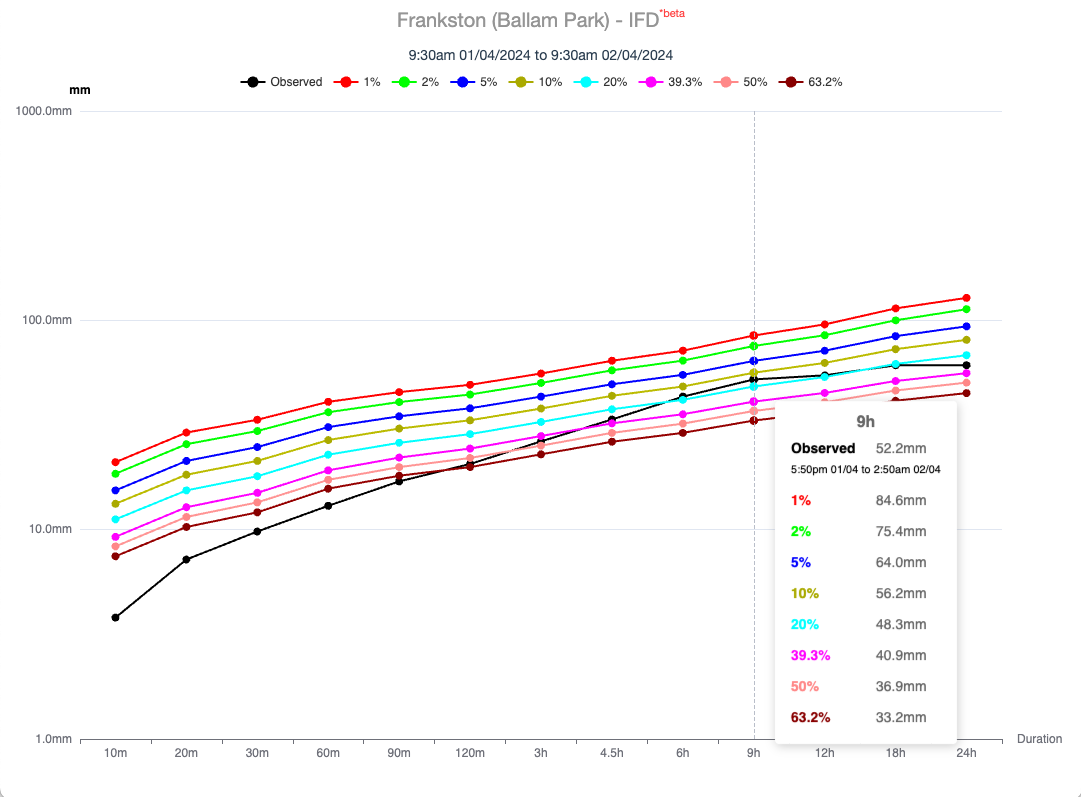
This observational data allows us to create the following IFD graph. Here you can see that the AEP is around 15% for the 9 hour total (or about once in every 7 years). You can hover over any of the points to see specific percentages for each of the time intervals shown across the X axis. Note that the Y axis is logarithmic.
Also if you want to show/hide different AEP lines, you can click on the element in the key at the top of the graph.
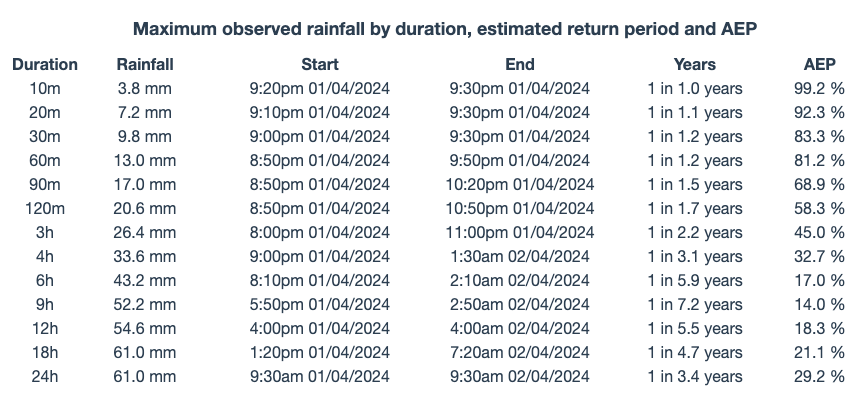
Below the graph is a table showing the maximum rainfall recorded in each of the intervals for the observed data along with the estimated AEP and return period which is based upon the design rainfall data. As you can see with this example it’s estimated that the 9 hour amount of 52.2mm for this location was about a 1 in 7.2 year event, or had a probability of occuring in any one year of about 14%.