

 Dark mode
 Light mode
Live 256km Adelaide Weather Radar - Rain Rate




Animation Controls






Intensity Filter
Light
Moderate
Heavy
 Adelaide Conditions & Forecast
Today
Cloudy


- Click the radar image to start and stop the animation. You can also use the play, stop, and step forward/back buttons below the image.
- Use the speed control (the tortoise and hare icons) to slow down or speed up the animation.
- On desktop, hover over the radar image and use the mousewheel to zoom, then click and drag to pan.
- Use the radar timeframe buttons above the radar to choose how far back to animate the observed images (e.g. −1h, −3h, −6h).
- When there is enough rain on the radar, +1h and +2h nearcast forecast buttons appear — tap ? next to them for details.
- Click the circular arrow live update button to automatically load new images as they arrive (free registration required).
- Tap the crosshairs icon on a GPS-enabled device to show your current location. Your location is never sent to or stored on our servers.
- Click the dashed circle marker icon to place a marker and track rain intensity at that point.
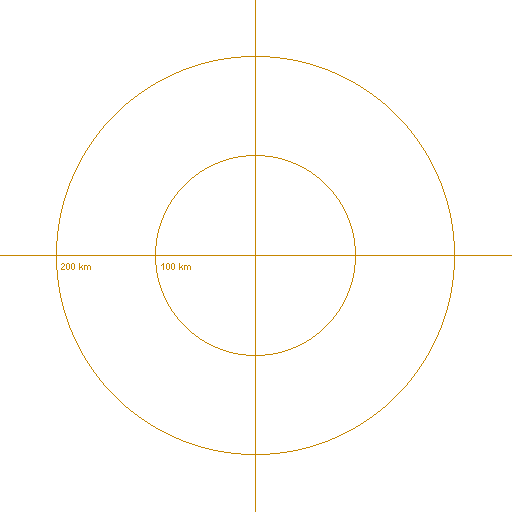
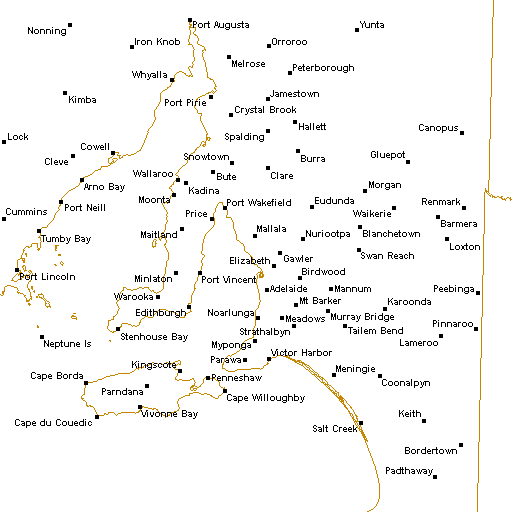
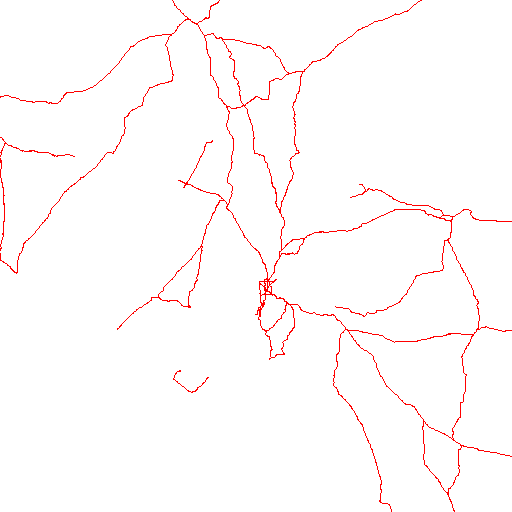
- Toggle map overlays on or off using the layer buttons: Topography, Range, Locations, Roads, Rail, Rivers, and Radars.
- Multiple layers can be active at the same time. Click a button again to turn it off.
- Nearby radars are shown with a dot-circle icon on the map. Click it to switch to that radar for the current timeframe.
- Your chosen layer settings are remembered if you have a registered account.
- Select an observation type to overlay weather station readings on the radar map: Temperature, Interval Rain, Rain since 9am, or Wind.
- Only one observation type can be shown at a time to keep the map readable. Select the same type again to hide observations.
- Click on an observation marker to see a detailed graph of readings from that station.
- This image shows the radar-derived estimate of rain that fell in the 24 hours to 9am (local time at the radar).
- A new image is issued once a day shortly after 9am, so there is a single image rather than an animation. The date and time of the displayed image are shown below it.
- Amounts are estimated from radar reflectivity and can differ from rain gauge readings, especially far from the radar, in showery conditions, or where the radar beam is partly blocked. Treat them as indicative.
- To watch rain totals build through the day, switch to the Rain since 9am product in the More menu above the radar.
- Radar images are © Australian Bureau of Meteorology.
- This product is a running total of rain since 9am (local time at the radar), estimated from radar. The total resets each day at 9am.
- Static shows the most recent image - a fresh image arrives every few minutes, and the time of the displayed image is shown below it.
- Animate today plays the total building from 9am this morning up to the latest image.
- Animate yesterday replays yesterday's full cycle, from 9am yesterday through to 9am this morning.
- Amounts are estimated from radar reflectivity and can differ from rain gauge readings, especially far from the radar or in showery conditions. Treat them as indicative.
- Animations require a Personal subscription.
- Radar images are © Australian Bureau of Meteorology.
- Drag the slider to the right to filter out lighter rain and highlight only moderate to heavy falls.
- This is useful for identifying storm cores and ignoring light drizzle or ground clutter.
- Drag back to the left to show all detected returns again.
- Drag the slider to the right to leave a fading "ghost" of recent frames behind the current frame, making the direction and speed of storm cells easy to see at a glance.
- Higher settings keep older frames visible for longer, producing a longer trail. Set to Off to disable.
- Works best while the animation is playing — the trail builds up over the last several frames as they advance.
- Pro subscription required.
- This graph shows the overall radar activity level across the entire radar range over time.
- Click and drag within the graph to quickly jump the animation to a specific time.
- Taller bars indicate more widespread or intense rain across the radar coverage area.
- This histogram shows the distribution of intensity values across the currently displayed radar frame.
- It helps you quickly understand whether rain is widespread and light, or concentrated and intense.
- Intensity values are indicative only and should not be used as precise measurements.
- Use the date and hour pickers to set a specific start and end time for the animation.
- Data is available as far back as March 2005, with older data available on request.
- A maximum of 500 frames can be shown at once, over a period of up to 14 days.
- Use the Timezone selector to view times in UTC or the radar's local timezone.
- Historical data access requires a Pro subscription.
Your Account
- If you register for a free account, your chosen settings will be remembered each time you visit.
- On a mobile device with GPS, tap the crosshairs icon to show your current position. Your location is never sent to or stored on our servers.
About the Data
- Images are typically updated every 5 minutes, though some radars and older data may be at 6 or 10 minute intervals.
- Data is available as far back as March 2005, with older data available on request.
- A maximum of 500 frames can be shown at once, over up to 14 days.
- Intensity values are indicative only and should not be used as precise measurements.
- Not all images are available for all locations — this may be due to radar outages or data transfer issues.
- Radar images are © Australian Bureau of Meteorology.
Questions or suggestions? Contact us — we'd love to hear from you.
 Install


